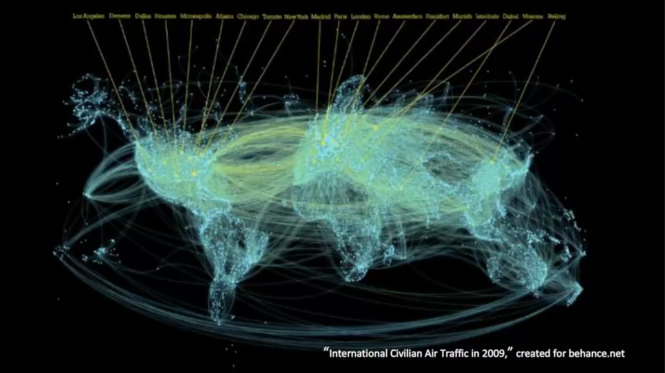
Data visualisation is a medium that speaks to people, as designers we need to take into account on how to visualise a data in order for it to communicate and tell a story.
If we compare the date consumed in 2002 and today. The amount of data consumed was 23 exabytes which is equivalent to 23 billion gigabytes was recorded in the year 2002 compared to the data we use today which consume that data in around seven days
Data visualisation is the representation of data with the use of graphs and images. Data on its own is hard to understand and would need to be interpreted and designed by designers so others will be able to relate and understand the data easily.
